Data Visualisations
Data visualisations are an important first step in many data science projects as understanding the data is often key to successful outcomes.
It is often part of exploratory data analysis (EDA) where the data is studied to understand its characteristics, properties and dimensions.
Data visualisations can assist organisations in many ways:
- Become data-driven organisations
- Better understanding complex data
- Reducing large datasets into graphs and tables that can be more easily comprehended
- Identifying relationships between data
- Identifying missing data and outliers in datasets. This is particularly important in machine learning projects.
- Creating a narrative around data
- Highlight organisational strengths and weaknesses
- Improve the decision making process
Data visualisations can take many forms:
- Interactive dashboards
- Graphs and charts
- Plots
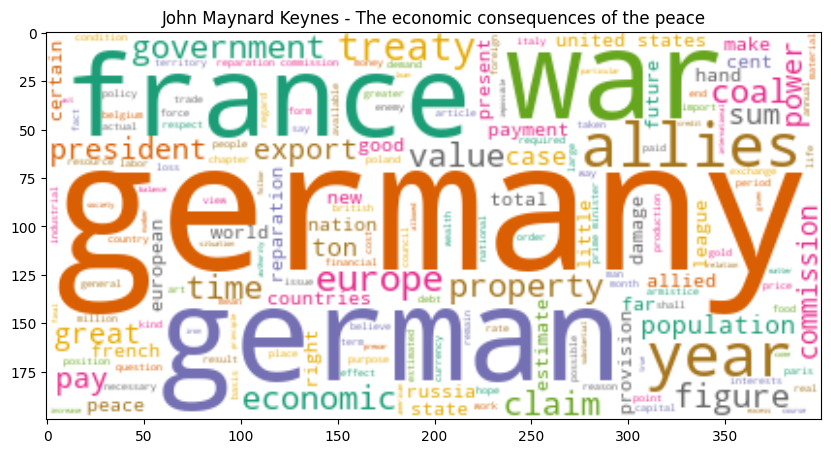
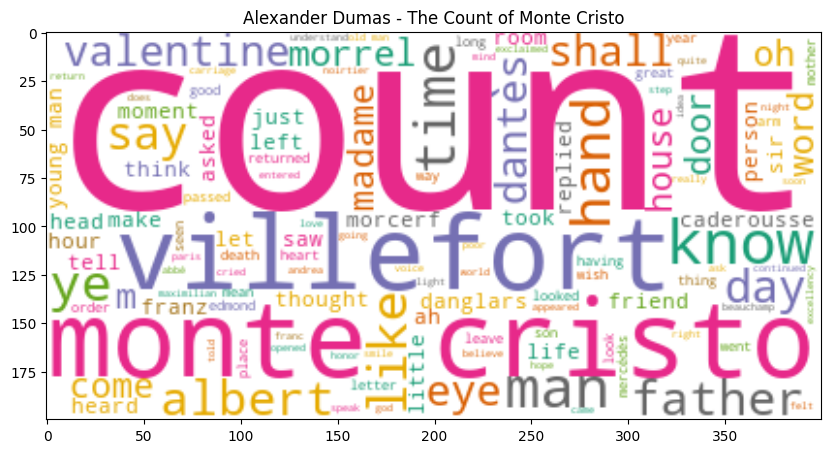
- Word clouds
- Probability distributions
- Tables that aggregate and summarise data
- Infographics
- Images
There are many options for creating data visualisations. Many programming languages including python and R can create high quality charts and visualisations.
Visualistion tools like Tableau can use data from many sources to create dashboards and provide interactivity. These can allow users to drill down on complex data. This can often assist in better understanding data, gaining useful insights and improving decision making.
Visualisations